Account
New to ADSS? Open an
account now to get started.
Already have an account?
Add funds to your ADSS account
Account
New to ADSS? Open an
account now to get started.
Add funds to your ADSS account


Asset Watch
Tuesday, April 18, 2023
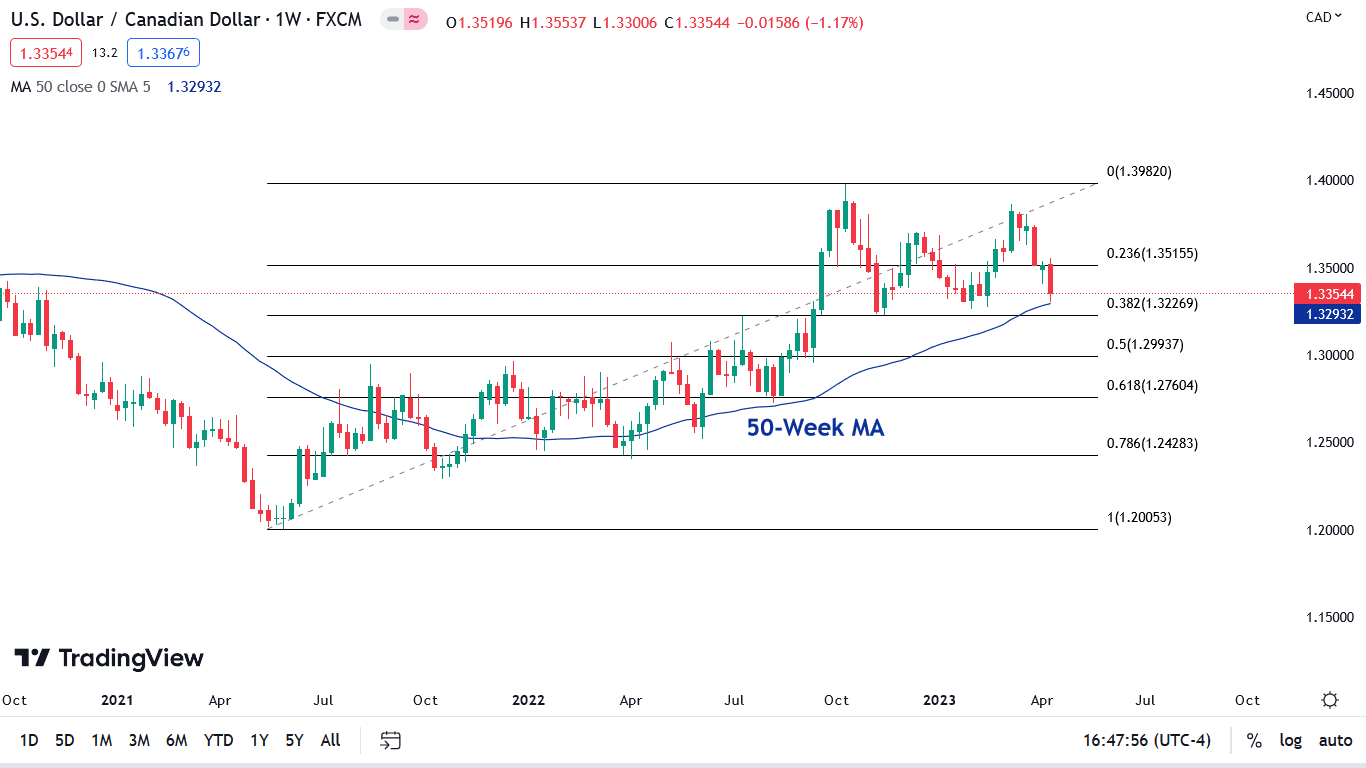
Even though the USD/CAD ended the Apr. 14 session below its 200-day moving average, it bounced near its 50-week MA. And with the latter acting as weekly support since 2022, further strength near 1.33 is a bullish sign.
On top of that, the USD/CAD’s 38.2% Fibonacci retracement level (1.3227) acted as resistance in July and August 2022, was support in November 2022, and, to a lesser degree, was also support in January 2023. Therefore, another line of defence is present if the currency pair breaks below the 50-week MA.
So, does the USD/CAD have the fuel to ignite a bullish fire, or will its neighbour to the north win the FX battle over the next few months?
ADSS
8th floor, CI Tower
Corniche Road
PO Box 93894
Abu Dhabi
United Arab Emirates
Trading Services
ts@adss.com
+971 2 657 2414
Investing in CFDs involves a high degree of risk that you will lose your money due to the use of leverage, particularly in fast moving markets, where a relatively small movement in the price can lead to a proportionately larger movement in the value of your investment. This can result in loses that exceed the funds in your account. You should consider whether you understand how CFDs work and you should seek independent advice if necessary.
ADS Securities L.L.C – S.P.C (“ADSS”), a limited liability company – sole proprietorship company incorporated under United Arab Emirates law. Registered under Commercial License No.1190047. ADS Securities L.L.C S.P.C is regulated and authorised in the UAE by the Capital Market Authority (CMA) under Category 1 License No.305027 (Trading Broker, Trading and Clearing Broker, Trading Broker in the International Markets, Trading Broker of OTC Derivatives and Currencies in the Spot Market, Financial Products Dealer) and Category 5 License No.20200000217 (Introduction). Registered Office: 8th Floor, CI Tower, Corniche Road, P.O. Box 93894, Abu Dhabi, United Arab Emirates.
The information presented is not directed at residents of any particular country outside the United Arab Emirates and is not intended for distribution to, or use by, any person in any country where the distribution or use is contrary to local law or regulation.
ADSS is an execution only service provider and does not provide advice. ADSS may publish general market commentary from time to time. Where it does, the material published does not constitute advice, or a solicitation, or a recommendation to a transaction in any financial instrument. ADSS accepts no responsibility for any use of the content presented and any consequences of that use. No representation or warranty is given as to the completeness of this information. Anyone acting on the information provided does so at their own risk.