Disclaimer: This article is an educational guide to CFD trading and the financial markets and should not be considered as advice. Trading CFDs is high risk. Always ensure you understand the potential risks and rewards associated with trading before you trade.
The vast array of factors that impact the global financial markets could overwhelm even experienced traders. Technical analysis helps cut down all this market noise and focus on price movements alone. It involves looking at historical price data and volume to predict future price movements. MetaTrader 5 (MT5) offers several tools that make technical analysis faster and easier.
MetaTrader 5 provides 3 types of charts, 38 technical indicators and 44 graphic objects to aid market analysis. This guide will help you learn how to use these.
Charting in MT5
Charts are the foundation of technical analysis. Let’s look at how to open and customise these charts.
Opening a Chart
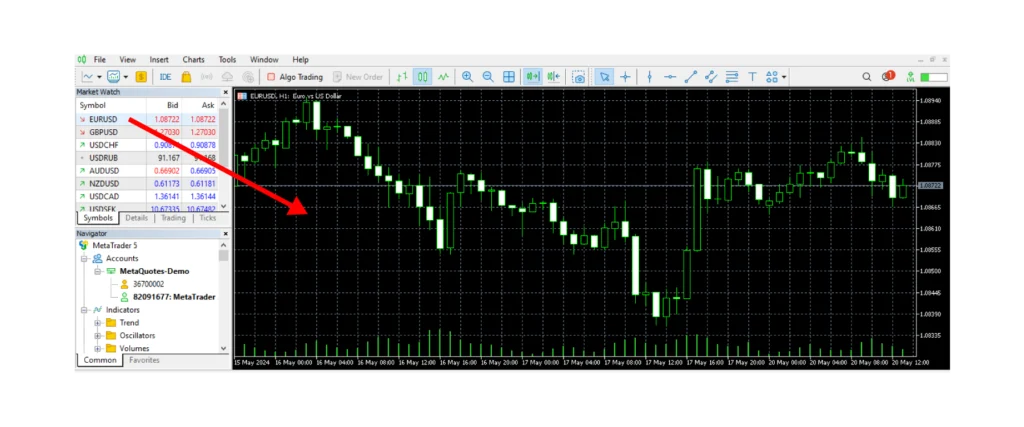
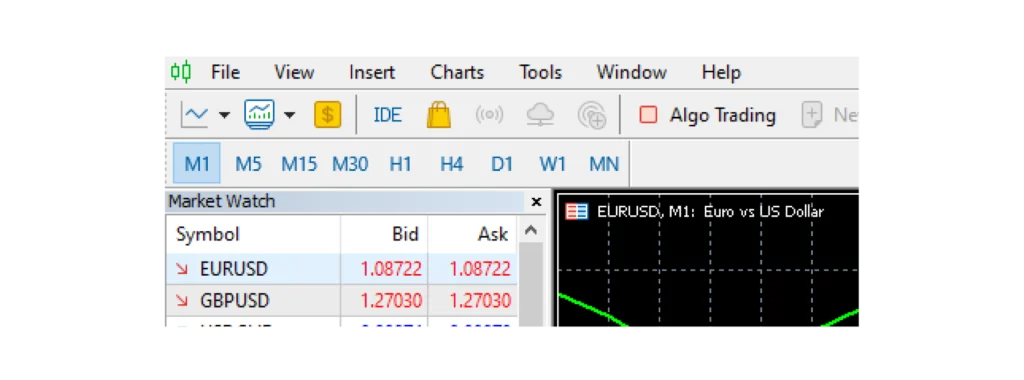
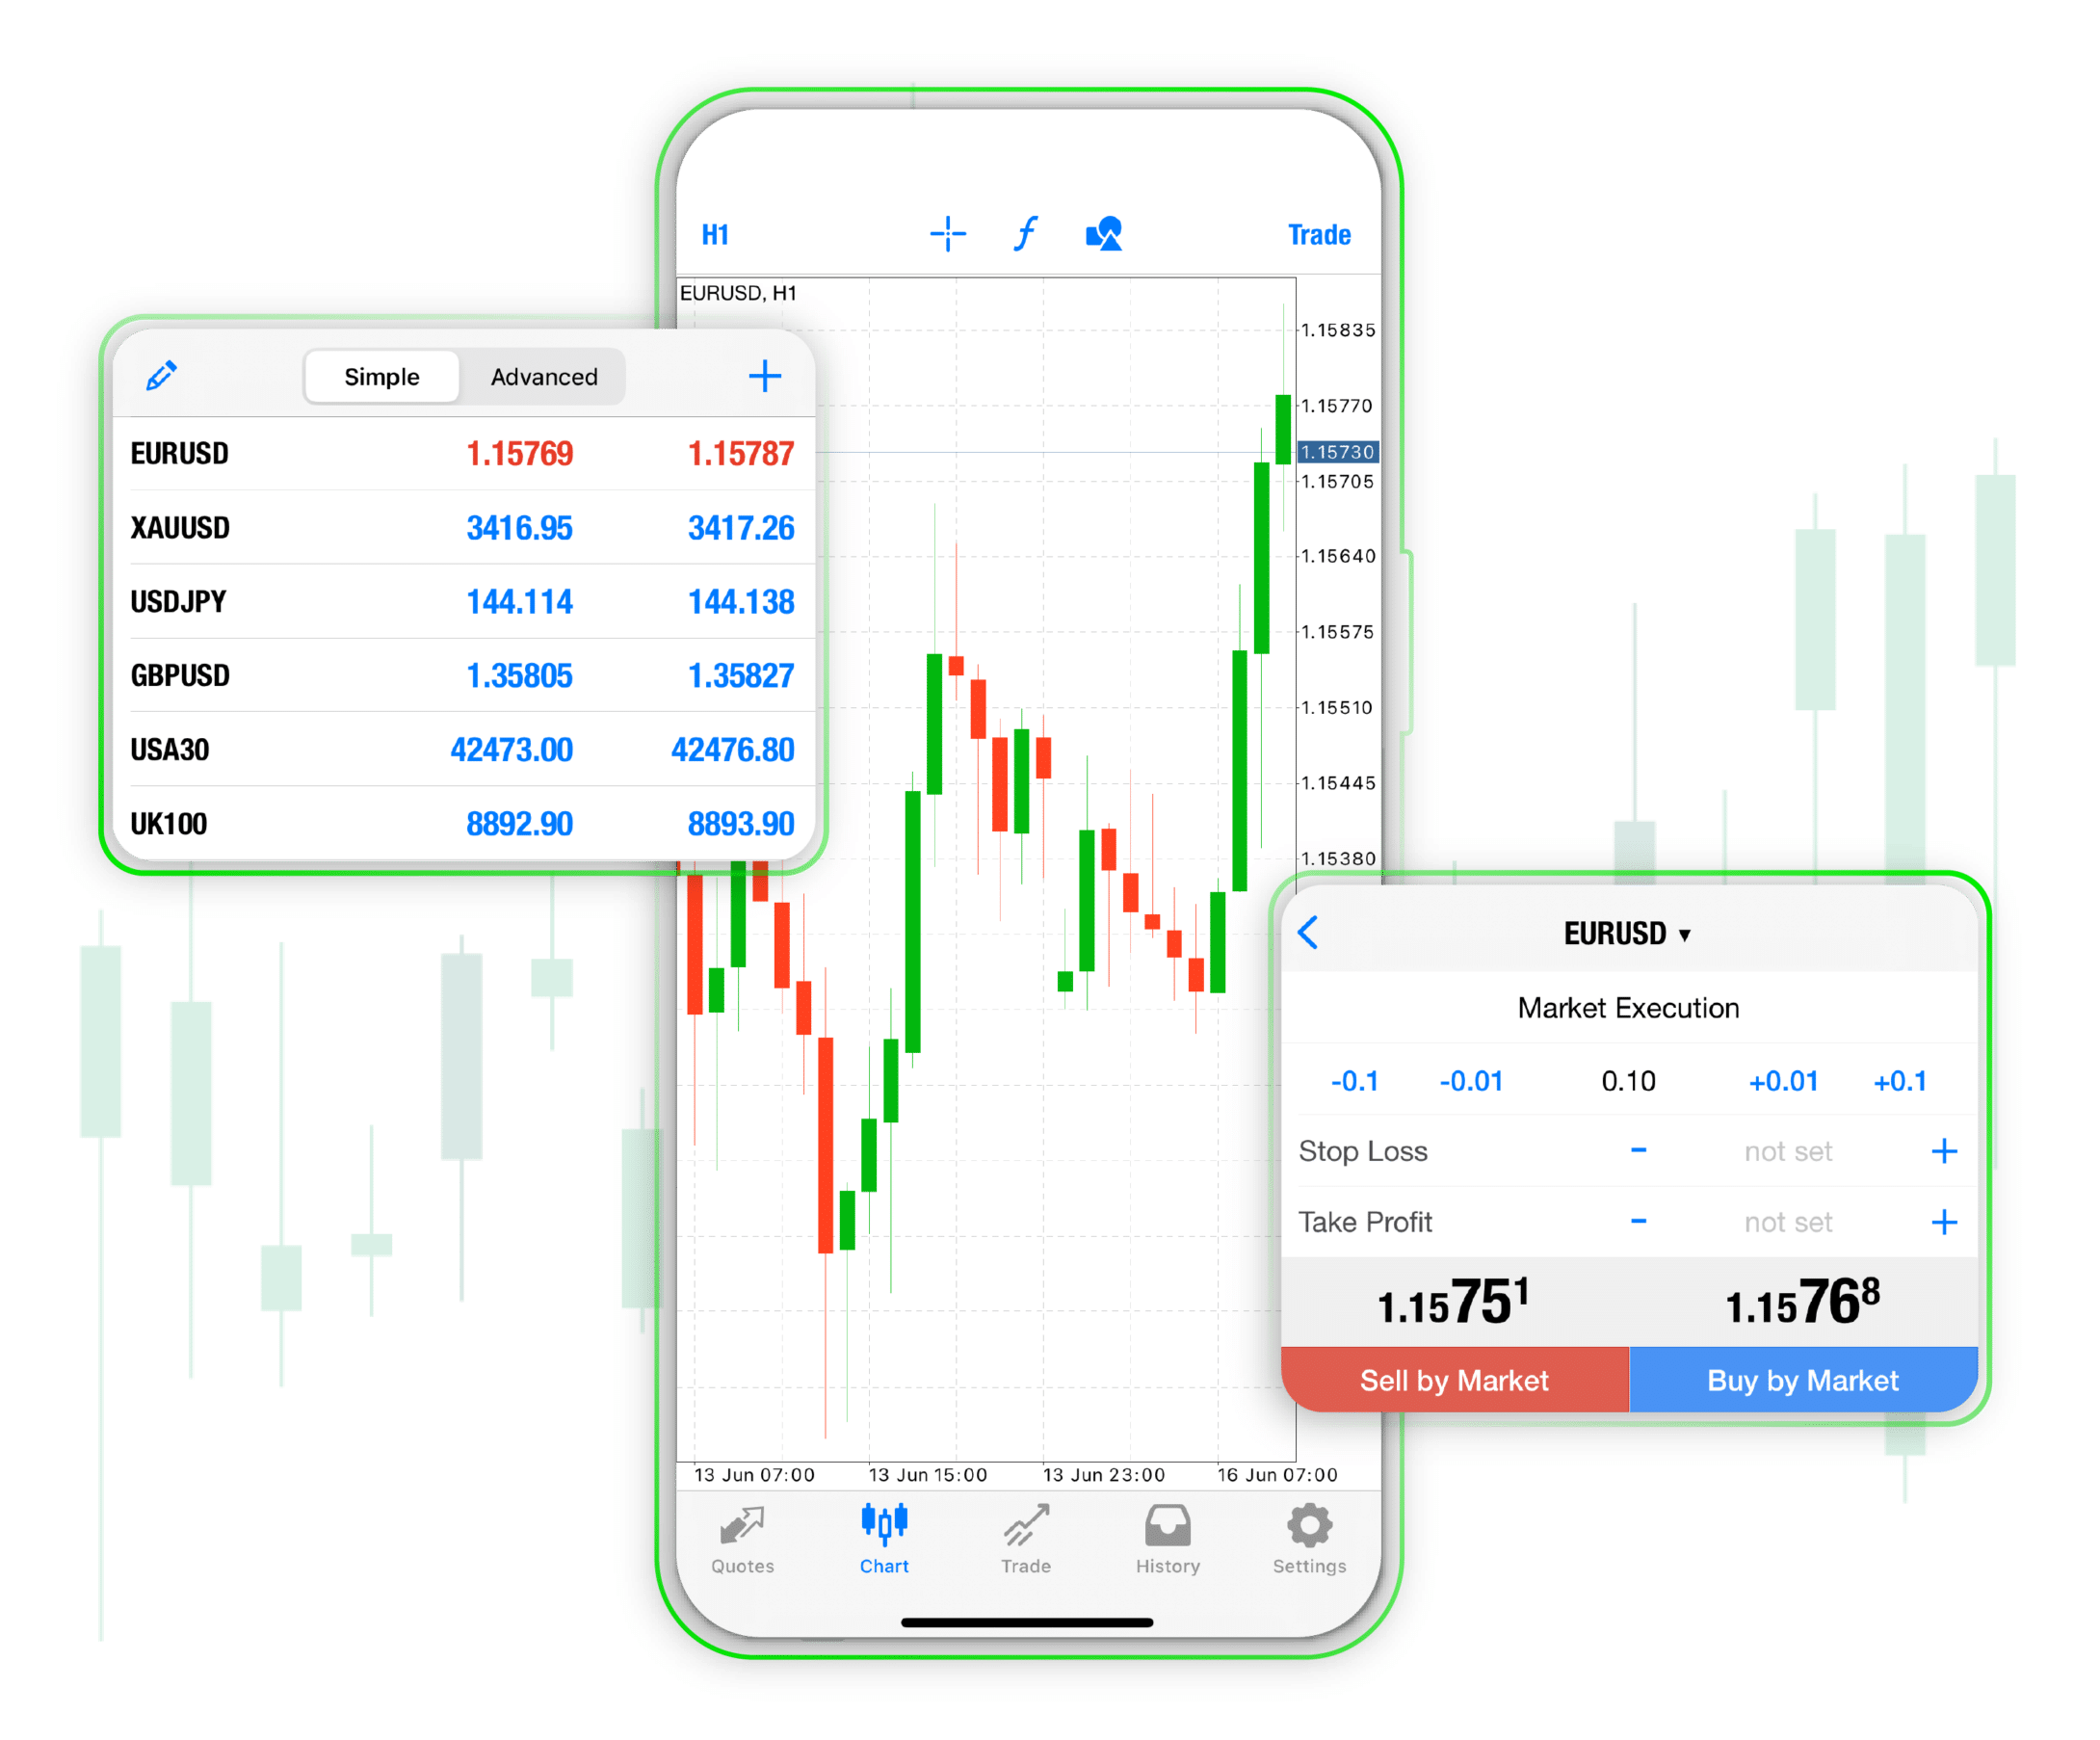
To open a new chart, simply drag your chosen asset from the ‘Market Watch’ window on the left of your MT5 platform and drop it onto the main charting area.
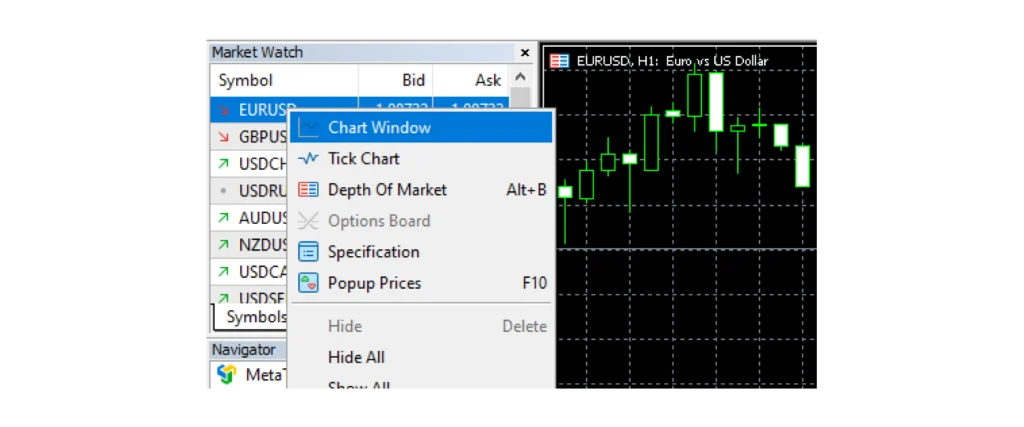
You can also right-click on the chosen asset in the Market Watch window and select ‘Chart Window’.
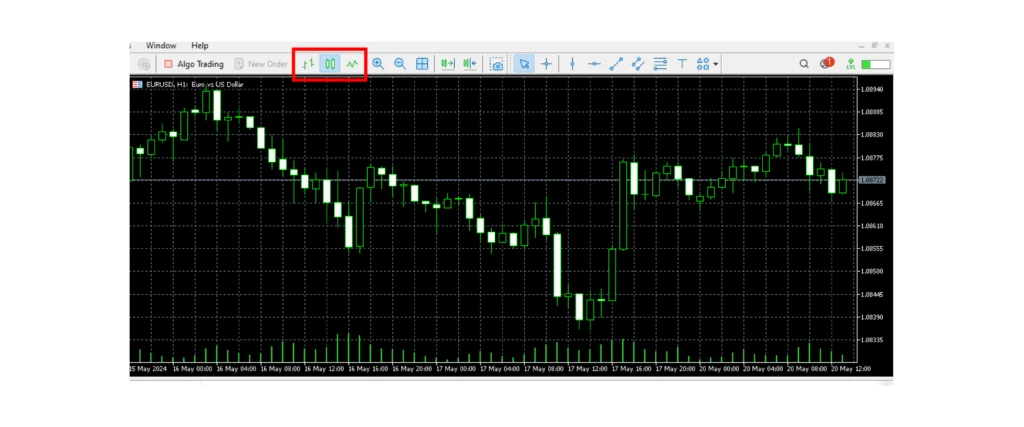
There are 3 types of charts on MT5. You can select your chosen one from the panel on top of the charting area.
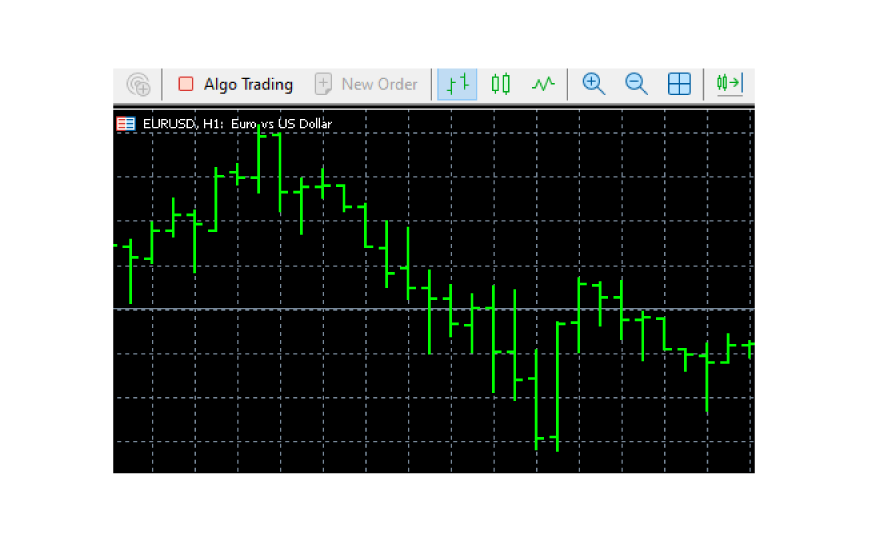
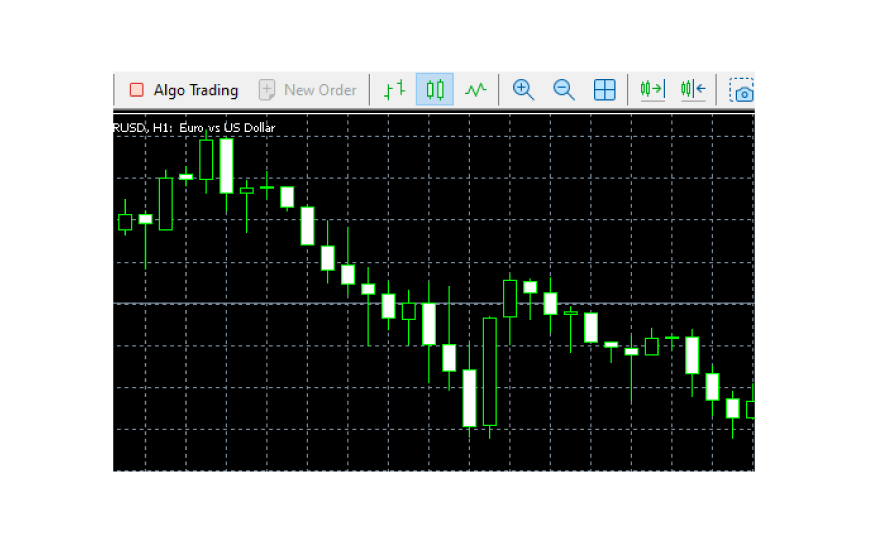
Option 1: Bar Chart – Displays the open, high, low, and close (OHLC) prices for each period. Each bar shows a vertical line representing the high-low range, with horizontal ticks indicating the open (left) and close (right) prices.
You can open this from the top panel or by pressing Alt + 1 on your keyboard.
Option 2: Candlestick Chart – The most popular choice, with each candlestick showing the OHLC (the body indicates the open and close, while the wicks indicate the high and low). The colour of the body indicates whether the price closed higher (bullish) or lower (bearish) than it opened.
Shortcut keys are Alt + 2 to open this chart.
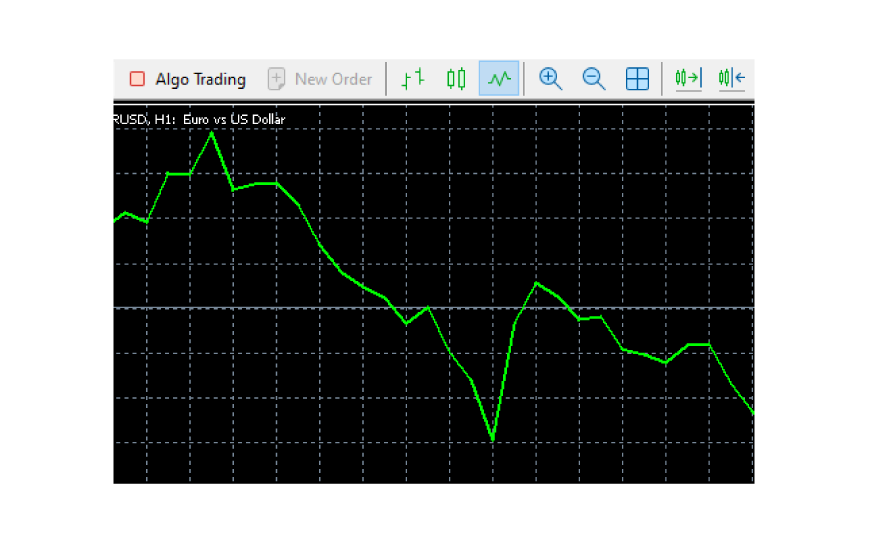
Option 3: Line Chart – Connects only the closing prices of each period, providing a highly simplified view that helps identify broader trends by smoothing out minor fluctuations.
Press Alt + 3 to open this chart from your keyboard.
Customising Chart Properties
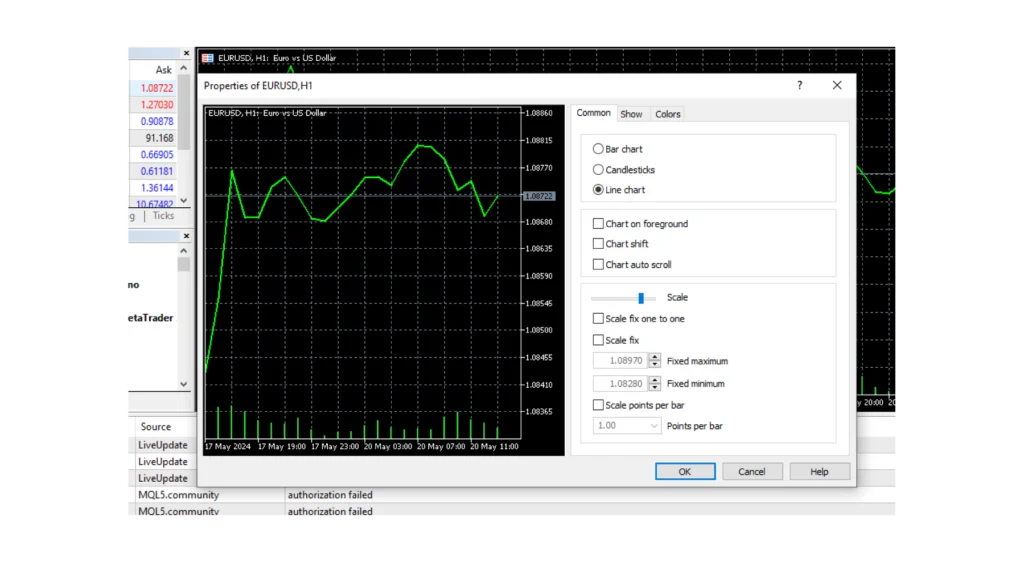
Right-click anywhere on the chart and select ‘Properties’. This opens a window with several tabs.
Common: Here you can adjust basic settings like displaying trade levels, volume, and chart shift (to leave space for future price action).
Show: Control elements like the OHLC line, Ask line, grid, and period separators.
Colours: This is where you can personalise your chart. Modify background, foreground, grid, bar colours, candlestick colours, and more to suit your visual preferences.
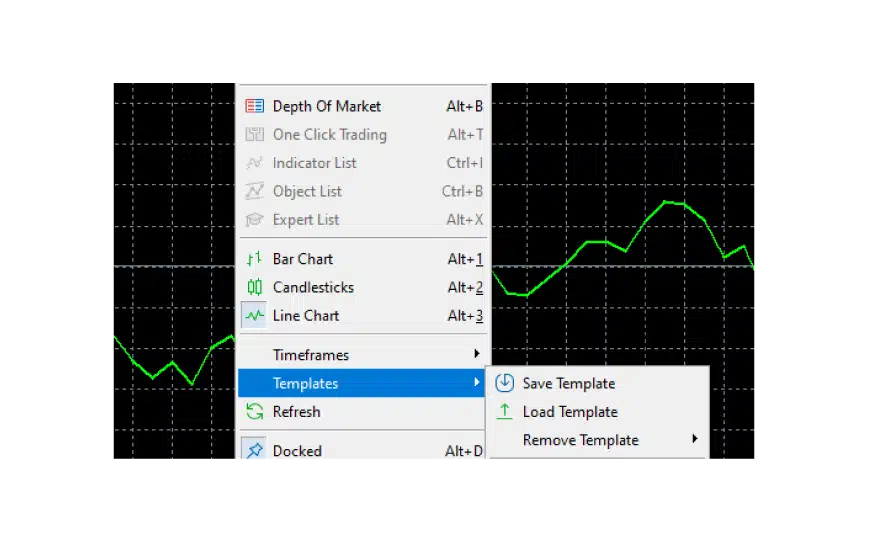
Templates: Once you’ve customised a chart to your liking with specific indicators and drawing tools, you can save it as a template.
For this, right-click on the chart, select ‘Templates’ and then ‘Save Template’. This allows you to quickly apply your preferred setup to any new chart.
Choosing the Timeframe
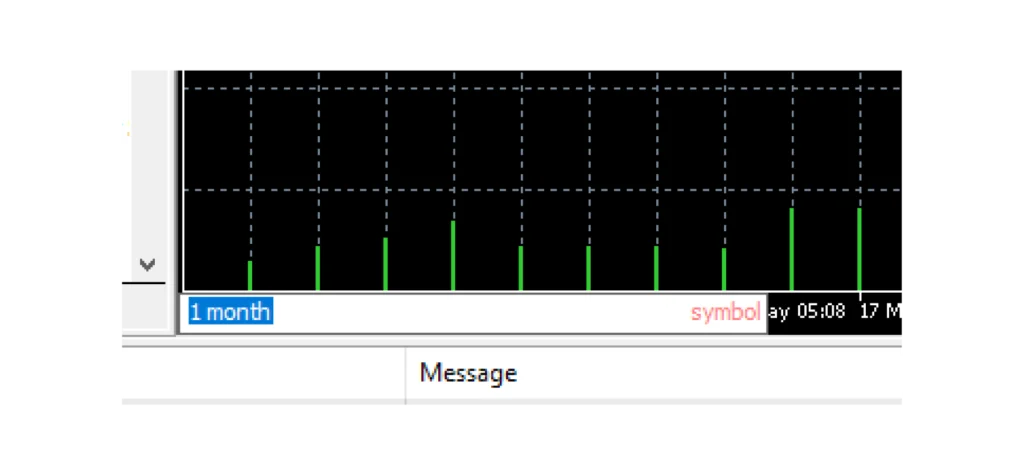
MT5 offers a wider range of timeframes than MT4. There are 21 different timeframes, allowing you to analyse price data from short- to long-term perspectives. There are minute charts, hourly charts and a 1-month chart.
To select the timeframe, simply click on the desired one on top of the chart.
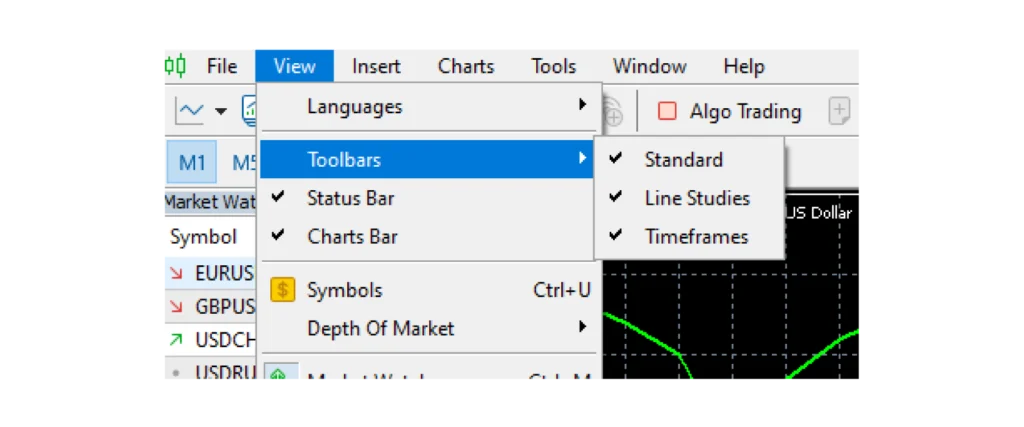
If this is not visible, go to ‘View’ and click ‘Toolbars’ and then ‘Timeframes’ to make them appear on top.
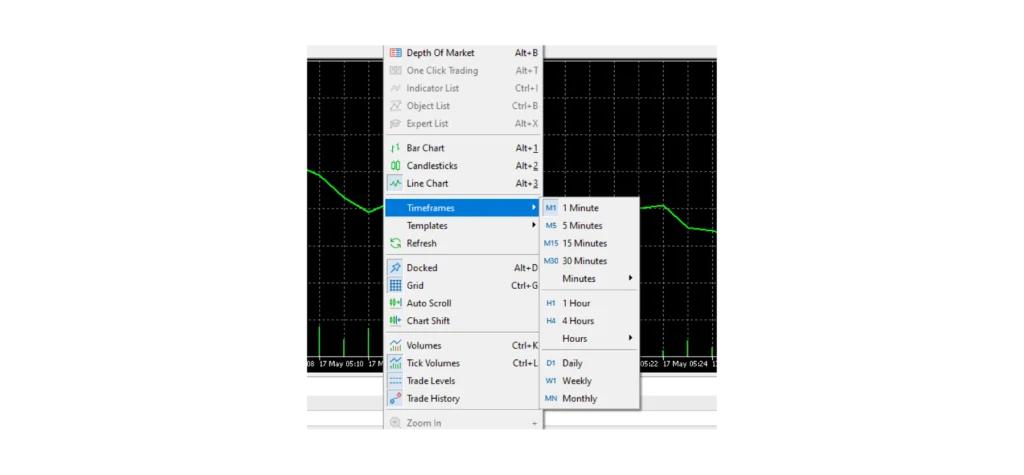
You can also right-click on the chart, hover over ‘Timeframes’ and select your desired one.
You can also right-click on the chart, hover over ‘Timeframes’ and select your desired one.
Charting Tools
Here are some of the most commonly used tools in MT5:
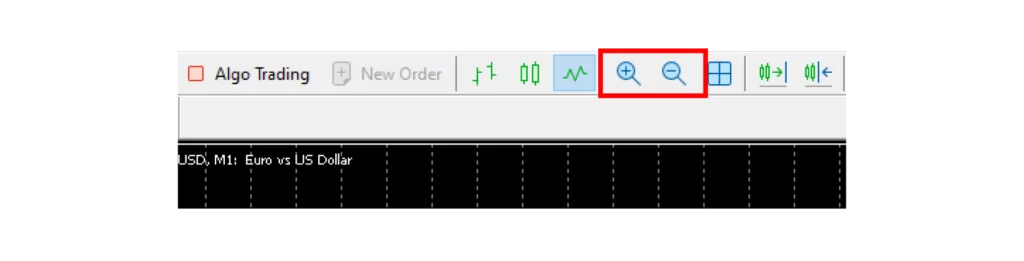
Zoom In/Out: Use the magnifying glass icons in the toolbar to adjust the zoom level of the chart. The mouse scroll wheel can also be used.
Scroll Chart: Click on the chart and drag it horizontally from left to right or right to left to move through historical data.
Chart Shift: Adds an empty space on the right side of the chart, allowing you to clearly see recent price action without it being cut off by the edge of the window. Click the chart shift icon (two candles with an arrow pointing right or left) on top of the chart area.
Technical Indicators
MT5 comes loaded with 38 preinstalled technical indicators. These are segregated in different folders, depending on the type of indicator.
Trend Indicators: These help identify and confirm the direction of a trend. While Moving Averages (Simple and Exponential) smooth price data to reveal underlying trends, ADX DI (Average Directional Index) gauges trend strength. Ichimoku Cloud (also called Ichimoku Kinko Hyo) provides a comprehensive view of support/resistance, momentum, and trend direction.
Oscillator / Momentum Indicators: These measure the speed of price changes, helping identify overbought/oversold conditions and potential reversals. Examples include RSI (Relative Strength Index), MACD (Moving Average Convergence Divergence), and Stochastic Oscillator.
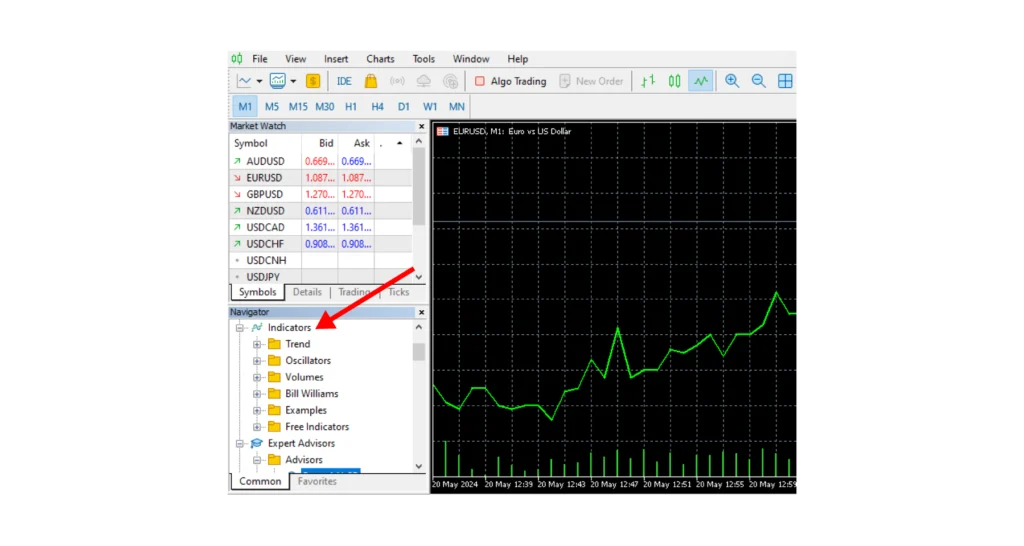
To access preinstalled indicators, simply go to the Navigator section under Market Watch. Then click on the ‘Indicators’ folder.
Several folders open. Now select the indicator of your choice from the folder and drag and drop it onto the chart.
Tip: Although Bollinger Bands is a volatility indicator, it is listed under the ‘Trend’ folder in MT5.
Drawing Objects
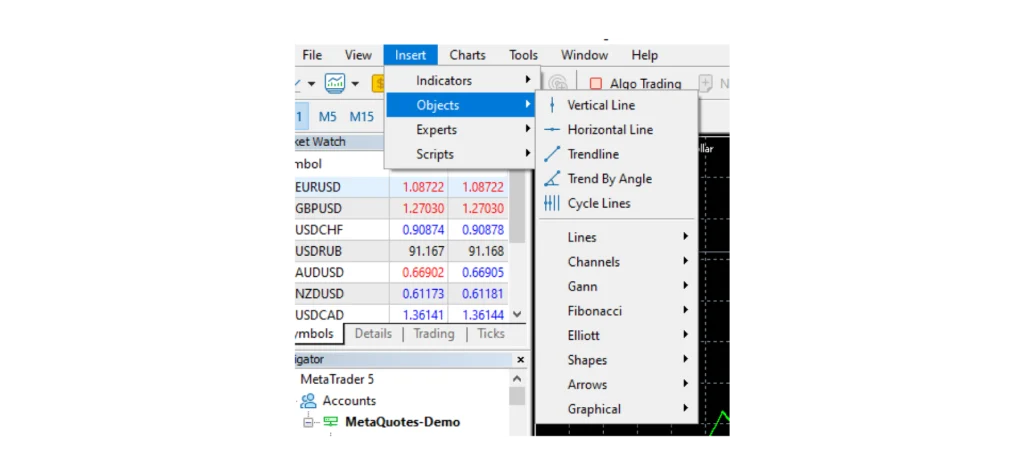
MT5 provides drawing objects that allow you to manually mark up your charts, identify patterns, and project potential price levels. To access these, go to ‘Insert’ in the top menu and then ‘Objects’ to choose your desired one.
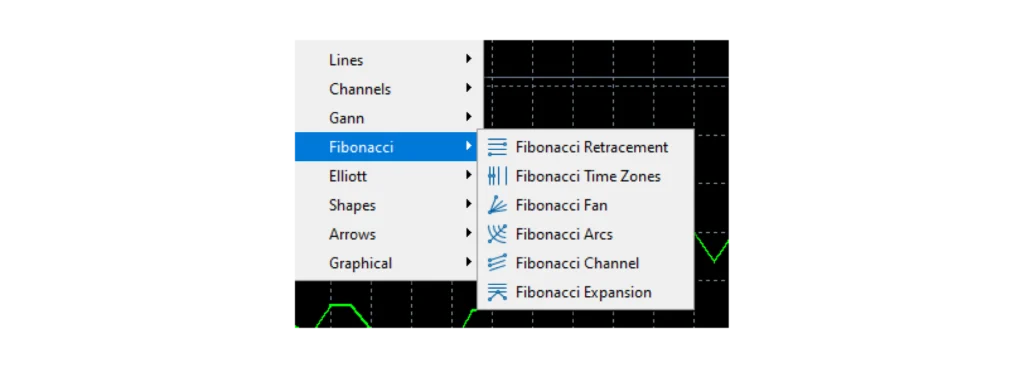
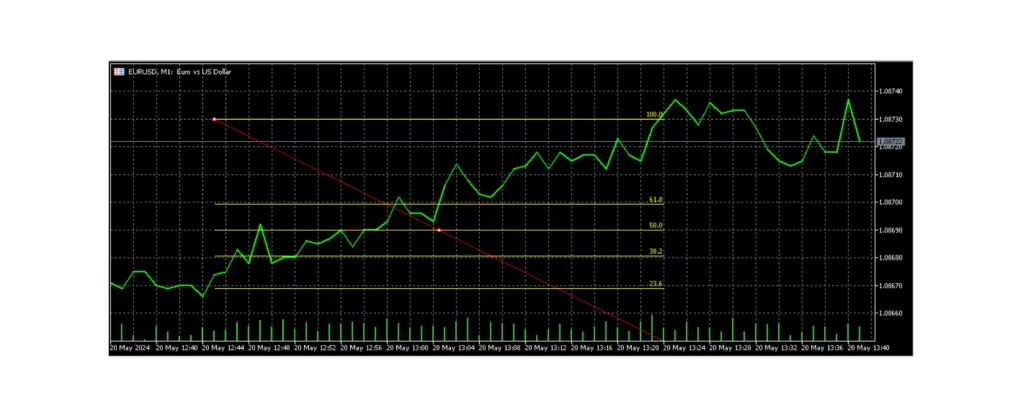
You can customise some of the charts. Take, for example, the Fibonacci, which gives several options.
The Fibonacci Retracements help identify potential support and resistance levels where price might retrace before continuing its trend. Simply click on ‘Fibonacci Retracements’ and then drag on the chart area you’d like to use the object.
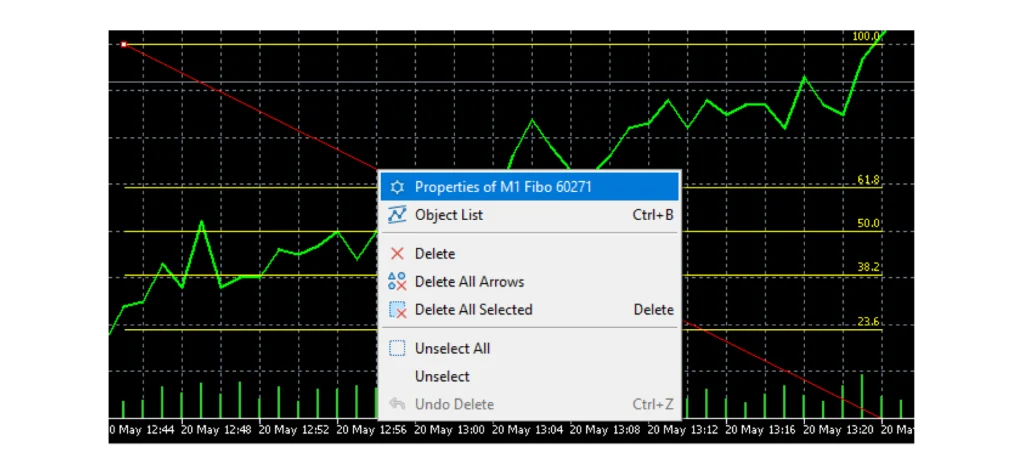
To customise the object, right-click on the object (in this case the Fibonacci retracement) and click on ‘Properties’.
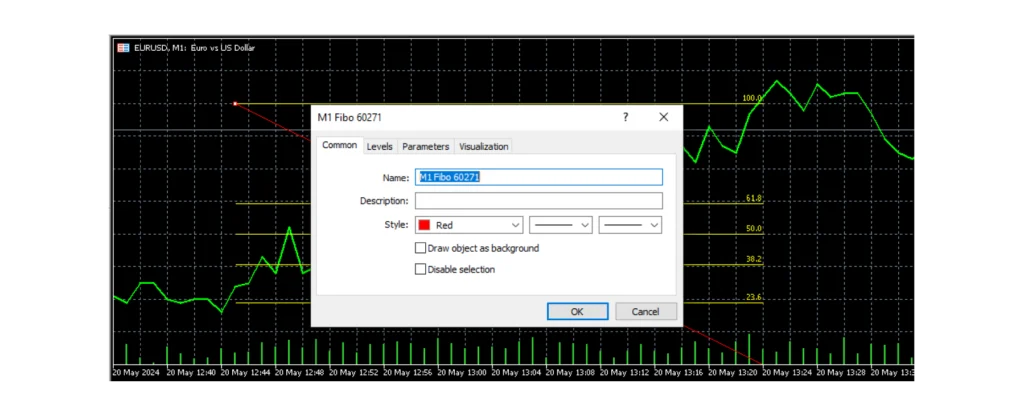
A popup will open, showing various options to customise.
In the ‘Common’ tab, you can change the colour, style and thickness of the retracement line.
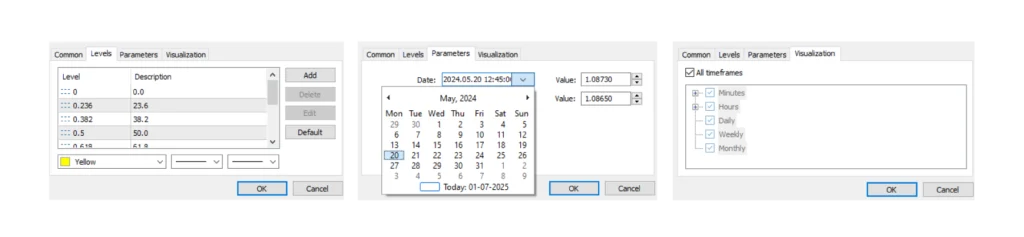
In the ‘Levels’ tab, you can add new Fibonacci levels (like 161.8% and 261.8%), remove existing ones. This allows you to tailor the levels to your specific analysis. Choose the date range from the ‘Parameters’ tab and the timeframes from the ‘Visualisation’ tab.
Gann Lines and Fans are commonly used drawing objects. Similar to Fibonacci, you can customise the angles, colours, and styles of Gann lines and fans through their properties.
Just like chart templates, you can save and load templates for specific drawing objects. This is particularly useful for complex Fibonacci or Gann setups that you may wish to reuse in different charts or for other instruments.
Platform
Kickstart your new trading journey with ADSS and MT5