Account
New to ADSS? Open an
account now to get started.
Already have an account?
Add funds to your ADSS account
Account
New to ADSS? Open an
account now to get started.
Add funds to your ADSS account


Asset Watch
Tuesday, December 6, 2022
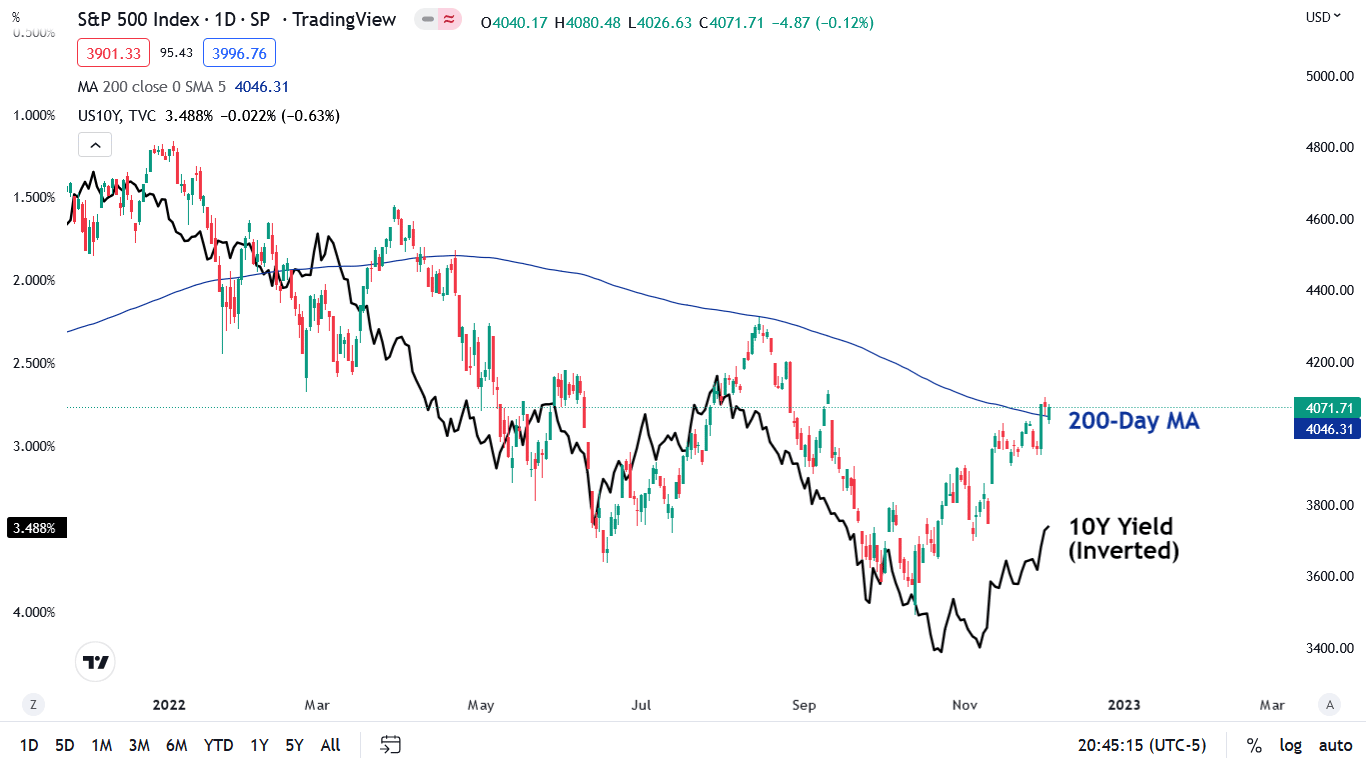
So, while conflicting opinions reign, could the S&P 500’s short-term fate come down to the performance of the U.S. 10-year Treasury yield?
The blue line shows how the S&P 500 closed above its 200-day moving average on Dec. 2, meaning the index’s technical strength remains. But the black line shows how the inverted (down means up) U.S. 10-Year Treasury yield has largely decided the S&P 500’s direction in 2022. In a nutshell: when interest rates decline, the S&P 500 rises.
Therefore, with the black line rising as interest rates fall, the S&P 500 has continued its positive response. Will the good times last, or is another rate rise on the horizon?
ADSS
8th floor, CI Tower
Corniche Road
PO Box 93894
Abu Dhabi
United Arab Emirates
Trading Services
ts@adss.com
+971 2 657 2414
Investing in CFDs involves a high degree of risk that you will lose your money due to the use of leverage, particularly in fast moving markets, where a relatively small movement in the price can lead to a proportionately larger movement in the value of your investment. This can result in loses that exceed the funds in your account. You should consider whether you understand how CFDs work and you should seek independent advice if necessary.
ADS Securities L.L.C – S.P.C (“ADSS”), a limited liability company – sole proprietorship company incorporated under United Arab Emirates law. Registered under Commercial License No.1190047. ADS Securities L.L.C S.P.C is regulated and authorised in the UAE by the Capital Market Authority (CMA) under Category 1 License No.305027 (Trading Broker, Trading and Clearing Broker, Trading Broker in the International Markets, Trading Broker of OTC Derivatives and Currencies in the Spot Market, Financial Products Dealer) and Category 5 License No.20200000217 (Introduction). Registered Office: 8th Floor, CI Tower, Corniche Road, P.O. Box 93894, Abu Dhabi, United Arab Emirates.
The information presented is not directed at residents of any particular country outside the United Arab Emirates and is not intended for distribution to, or use by, any person in any country where the distribution or use is contrary to local law or regulation.
ADSS is an execution only service provider and does not provide advice. ADSS may publish general market commentary from time to time. Where it does, the material published does not constitute advice, or a solicitation, or a recommendation to a transaction in any financial instrument. ADSS accepts no responsibility for any use of the content presented and any consequences of that use. No representation or warranty is given as to the completeness of this information. Anyone acting on the information provided does so at their own risk.